![[ML]Basic Data Exploration](https://img1.daumcdn.net/thumb/R750x0/?scode=mtistory2&fname=https%3A%2F%2Fblog.kakaocdn.net%2Fdn%2FcYDO5E%2FbtrvodQWpPE%2FGgwOMBSs0PePKGbxkvSBpk%2Fimg.png)
1. Using Pandas to Get Familiar With Your Data
판다스는 데이터 사이언티스들이 데이터를 다루는 가장 원초적인 툴이다.
import pandas as pd 판다스 라이브러리에서 가장 중요한 부분은 데이터 프레임이다. 데이터 프레임은 테이블로 생각되는 데이터 타입을 가지고 있으며 엑셀의 sheet, SQL 데이터베이스의 테이블과 비슷하다.
# Save filpath to variable for easier access

melbourne_file_path = '../input/melbourne-housing-snapshot/melb_data.csv'

# read the data and store data in DataFrame titled melbourne_data

melbourne_data = pd.read_csv(mebourne_file_path)

# print a summary of the data in Melbourne data

melbourne_data.describe()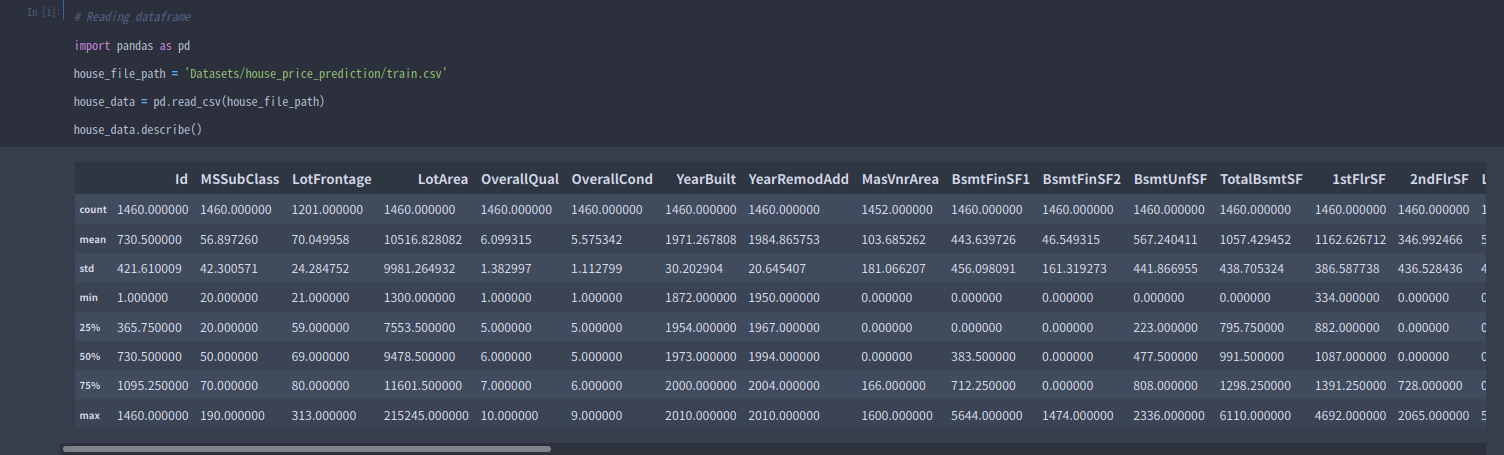
2. Interpreting Data Description
describe() 함수의 결과는 원래 데이터에 대해 각각의 컬럼에 대한 8개의 요약 통계량이다. 첫 번째 수인 count는 결측값을 제외한 데이터 값의 개수 이다.
두 번째 수는 평균, 그 밑으로 표준편차가 있다.
최솟값 25%, 50%, 75%, 최댓값을 이해하기 위해서 각 컬럼의 데이터를 작은 값부터 큰 값까지 일렬로 저장한다고 생각하면 된다. 가장 작은 값은 최솟값이고, 일렬로 존재하는 데이터의 25%의 값은 제 1사분위 수이다. 50%는 중쉬수, 75%는 제 3사분위수로 max는 최댓값을 의미한다.
3. Exercise : Explore Your Data
Step 1 : Loading Data
import pandas as pd

# Path of the file to read
iowa_file_path = '../input/home-data-for-ml-course/train.csv'

# Fill in the line below to read the file into a variable home_data
home_data = pd.read_csv(iowa_file_path)
Step 2 : Review The Data
# Print summary statistics in next line
home_data.describe()

# What is the average lot size (rounded to nearest integer)?
avg_lot_size = round(home_data.LotArea.mean())

# As of today, how old is the newest home (current year - the date in which it was built)
newest_home_age = 2021 - home_data.YearBuilt.max()
Source of the course : Kaggle Course _ Basic Data Exploration
'Course > [Kaggle] Data Science' 카테고리의 다른 글
| [ML] Model Validation (0) | 2022.02.14 |
|---|---|
| [ML] Your First Machine Learning Model (0) | 2022.02.14 |
| [Python] Renaming and Combining (0) | 2022.02.11 |
| [Python] Data Types and Missing Values (0) | 2022.02.11 |
| [Python] Grouping and Sorting (0) | 2022.02.11 |